Let me tell you about one of my favourite reports in Google Analytics, the channels report.
This report is great because it allows you to see how much traffic each of your digital marketing channels is driving to your site, how engaged that traffic is and which channels are returning the best results for donations, sales, leads, volunteer enquiries and other conversion actions.
Where to find the channels report

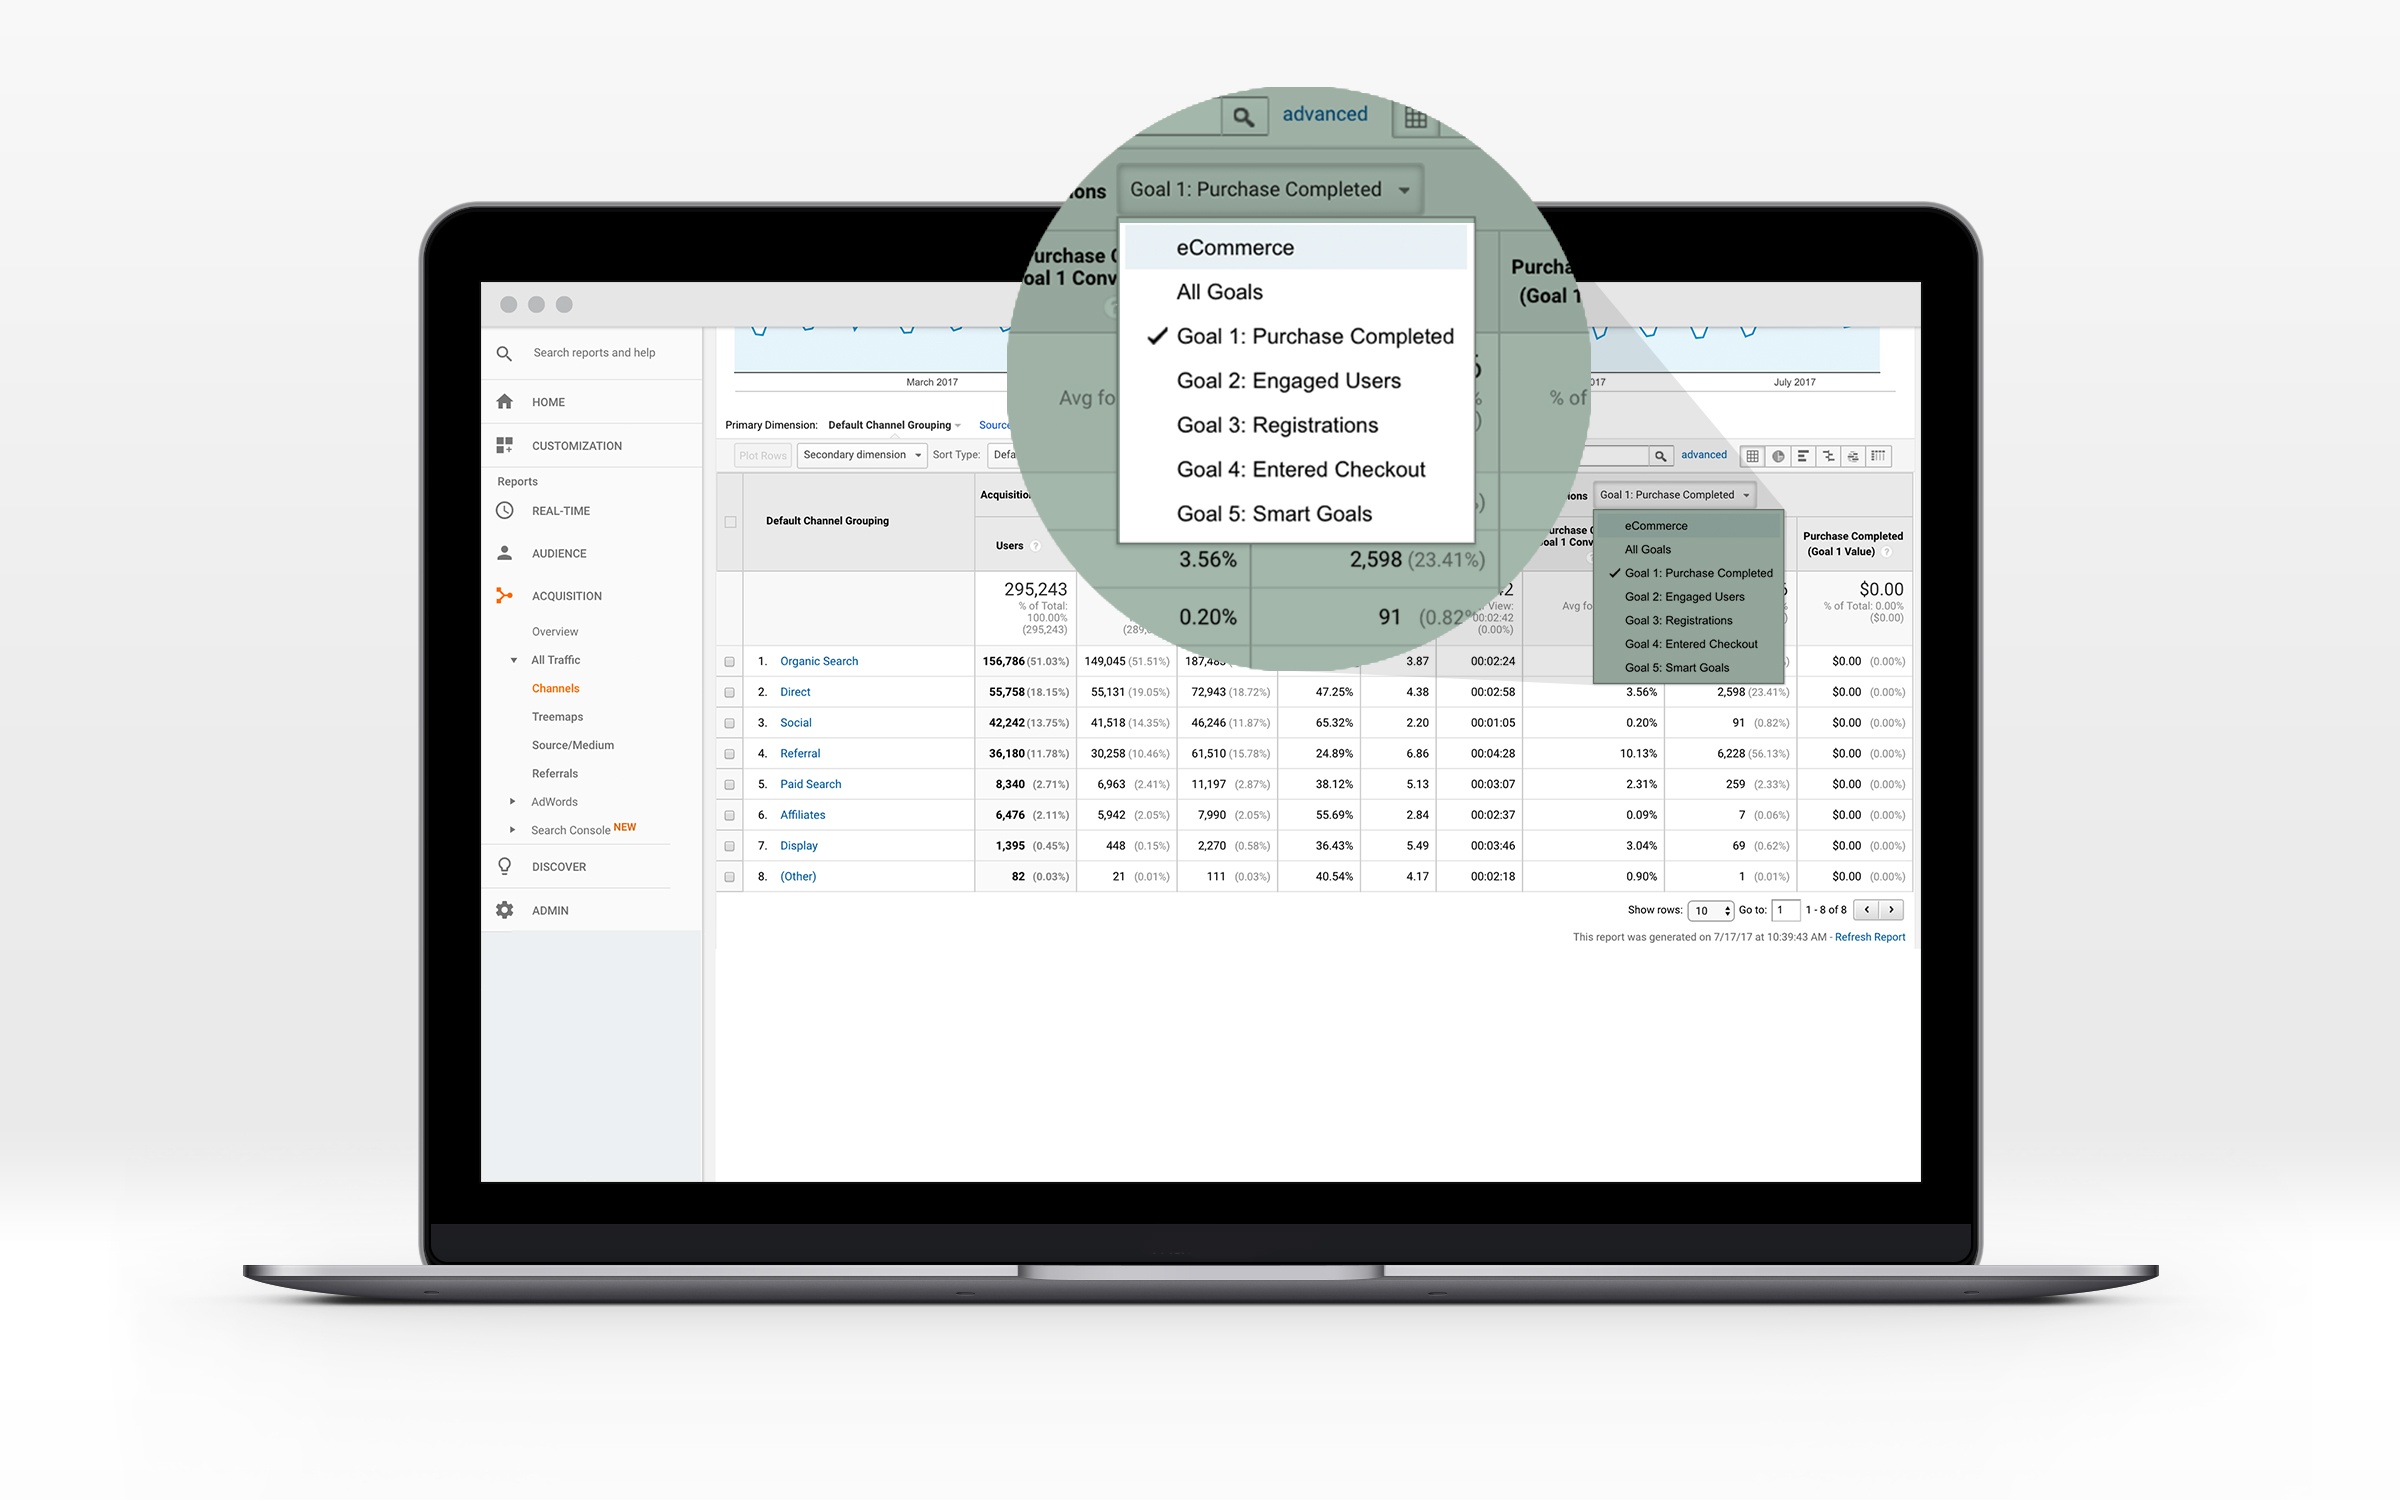
You can find the channels report under acqusition > all traffic > channels when you’re logged in to your Google Analytics account. Here you’ll see a list of different channels which you can sort by traffic, new users, conversions or time on site.
What to look for
There are lots of insights on this screen but here are some key things I like to look for.
Which channels drive the most traffic?
You can see this by taking a look at the users, new users and sessions columns. Users captures the total number of unique users that have come in via that channel, whereas sessions is the total number of visits. New users of course will show you how many people were first time visitors.
Which channels drive the most revenue?
The last columns in this report are dedicated to conversions. By clicking the dropdown, you can change this to show the ecommerce results. Of course, this is if you’ve set up e-commerce tracking. Here you can see how much each channel has contributed to online sales or donations. Just look at that return on investment!
Which channels drive the most enquiries?
If you’ve set up your goal tracking, you’ll be able to see conversion actions on your site, like enquiries, newsletter sign ups, video views etc. The channels report allows you to gain insights like which channel drives the most volunteer enquiry form completions or click to calls.
Which has the highest conversion rate?
Don’t just look at volume, also consider the fact that channels with smaller traffic volumes might be punching above their weight in terms of the percentage of visitors that take a positive conversion action. Imagine the effectiveness if you doubled the volume of traffic from that channel? This is a good way to inform where marketing time and dollars should be spent.
Can you see any variations in bounce rate or time on site?
Are you seeing a much higher bounce rate and shorter time on site from social or search traffic? While some variations are common, it’s good to keep an eye on how engaged the traffic from each channel is. A bounce rate of 90% and average time on site of 10 seconds from paid search traffic, for example, might mean you need to dive into Google Adwords and refine your keyword targeting or think about where that traffic is being sent.
Where are your referrals coming from?

Are you giving kudos where kudos are due? Clicking through to your referral traffic will allow you to see which other websites are referring traffic in your direction. Again, you can also see how these contribute to your online revenue or enquiries. Referrals could include paid directory listings, blogs or partner organisations linking to your site. This is a great way to know where to direct your love and thanks to other organisations who are driving high-quality traffic to your site (and consider finding more similar partners who might link to you!). You might also be able to save some pennies by not renewing listings or advertising that aren’t meeting your objectives.
If you’re interested in learning more about how to read and interpret data in Google Analytics, you should definitely join us at our webinar! I’d love to see you there.

Topics: Digital
